We describe here the dataproducts and catalogues extracted from the MaNGA SDSS-IV datacubes using the Pipe3D pipeline. Those dataproducts are the result of the analysis of the stellar populations and ionized gas described in detail in the following articles:
Sánchez et al. 2016a, RevMex, 52, 21
Sánchez et al. 2016b, RevMex, 52, 171
Sánchez et al. 2022, ApJS, 262, 365
The Value Added Catalog comprises a single FITS file per galaxy/datacube within the current MaNGA data release (v3_1_1). Each datacube (*.Pipe3D.cube.fits.gz) comprises six extensions: the first extension corresponds to the header of the original cube (including the World Coordinate System WCS), and the remaining five extensions correspond to a set of datacubes (described in the FITS files Data Model), containing stellar population properties, star formation histories, emission line fluxes, stellar absorption line indices and additional emission line flux with an updated list of emission lines.
In addition to the individual FITS files for each galaxy, we also provide a single table with one entry per galaxy, comprising the integrated properties of those galaxies (e.g., stellar mass, star-formation rate), and the characteristic values (e.g., oxygen abundance at the effective radius), together with relevant information about the galaxy (e.g., ionization conditions in the center of the galaxy). A detailed description can be found in the Catalog Data Model.
In addition to the two different types of files described above, we also include a quality control catalog within this VAC, as described in the Quality Control database Data Model.
In total we provide the described dataproducts for 10243 out of 10245 galaxy cubes included in MPL-11. The remaining ones have issues with the data (low S/N, masked areas, problems with the spectrophotometric calibration), therefore the pipeline fails when trying to analyze them. In addition we have a set of cubes/galaxies for which the fitting presents some problem or we are not satisfied with the quality in general. Therefore, in the catalogue of integrated/characteristic properties there is a total of 10243 galaxies, and the same number of dataproducts cubes comprise.
Example of the dataproducts
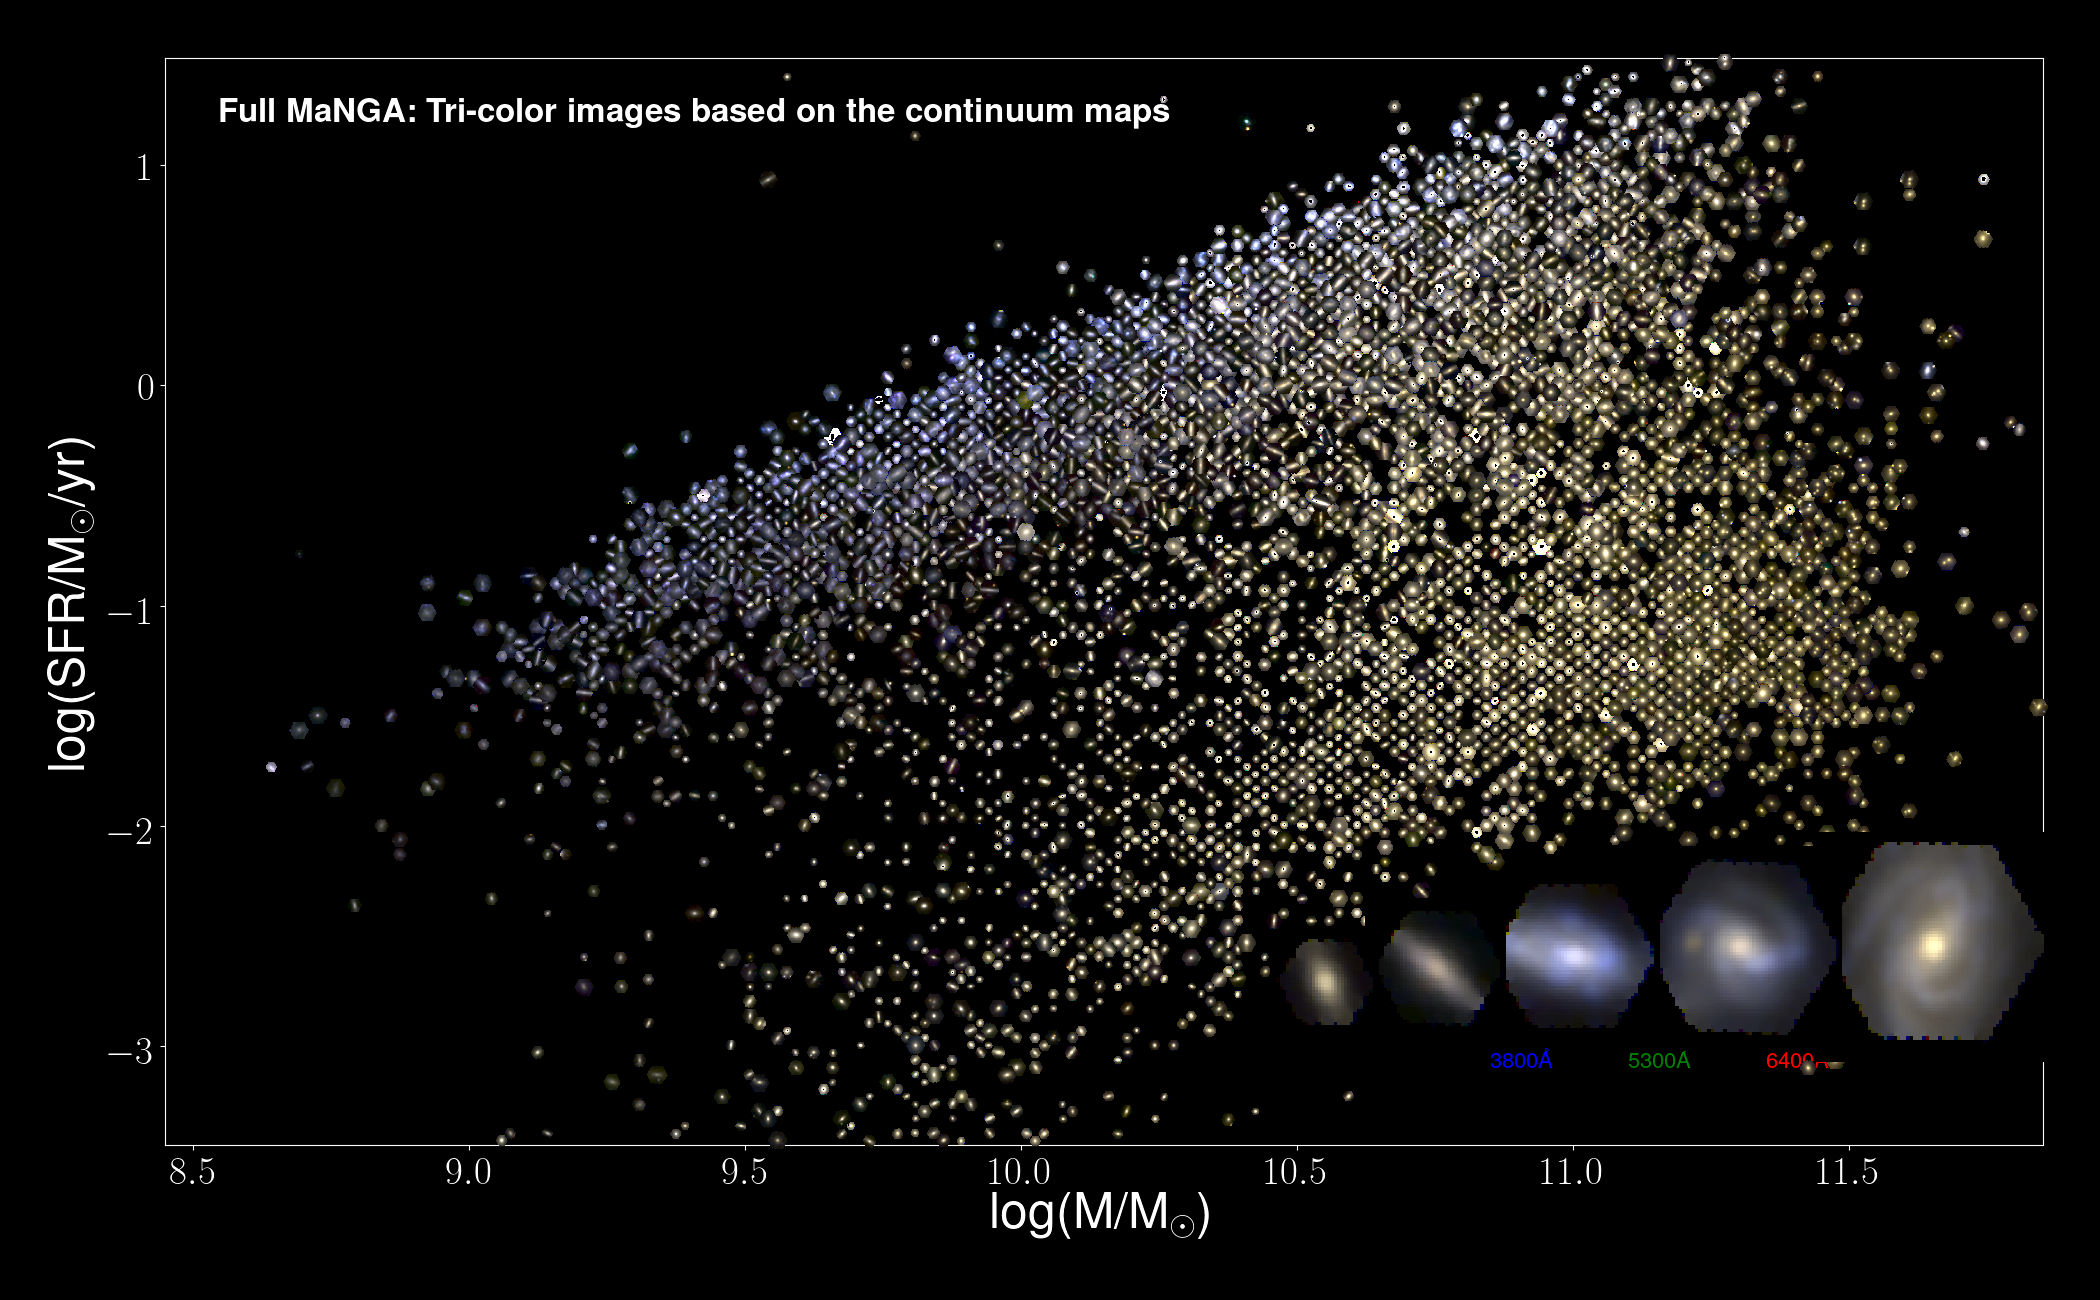
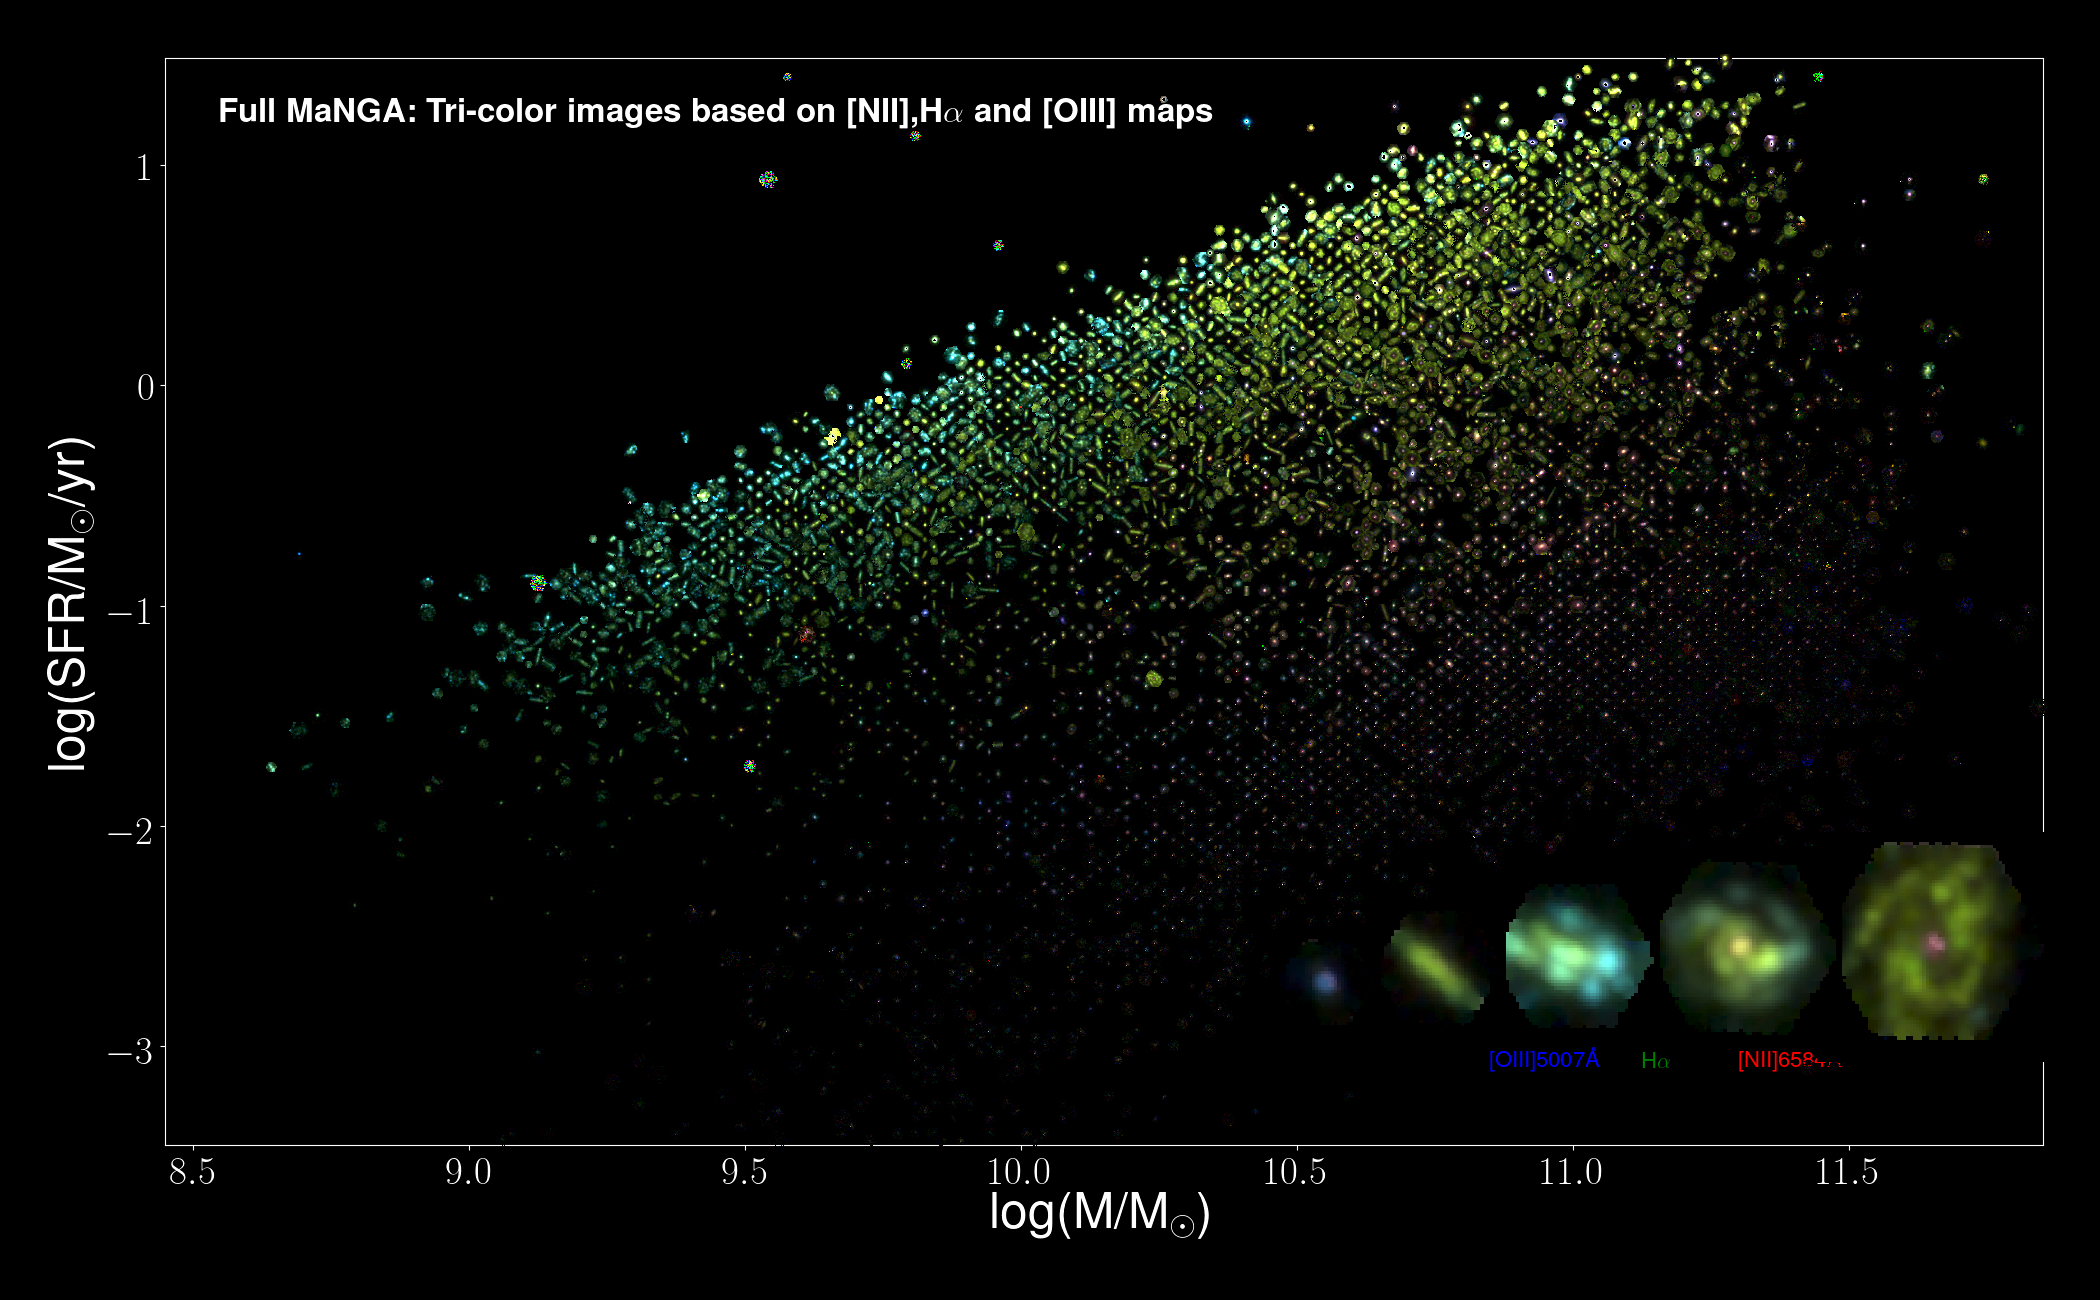
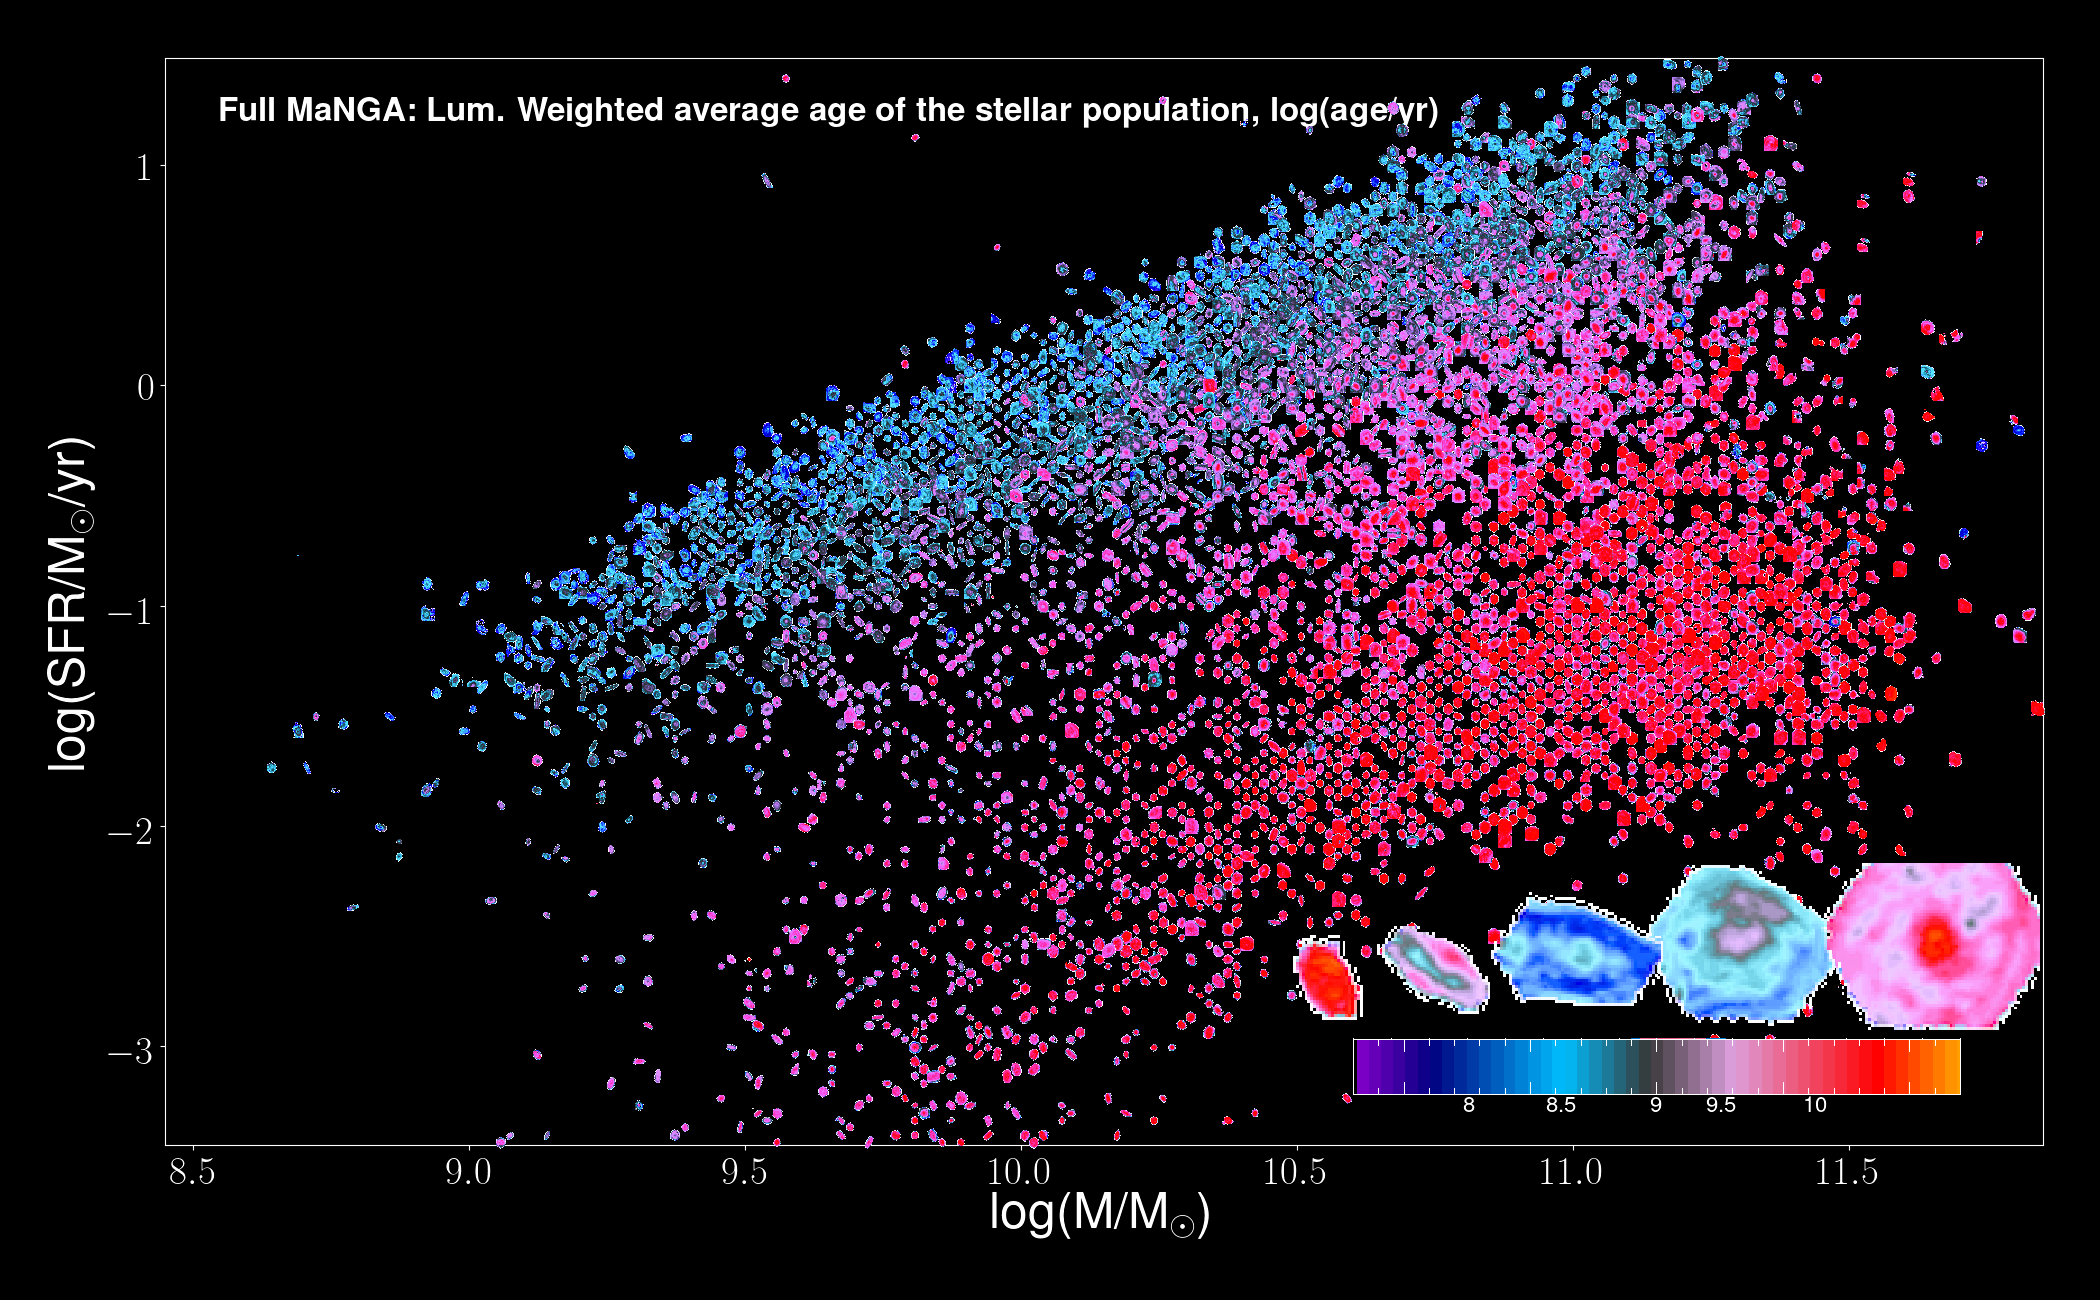
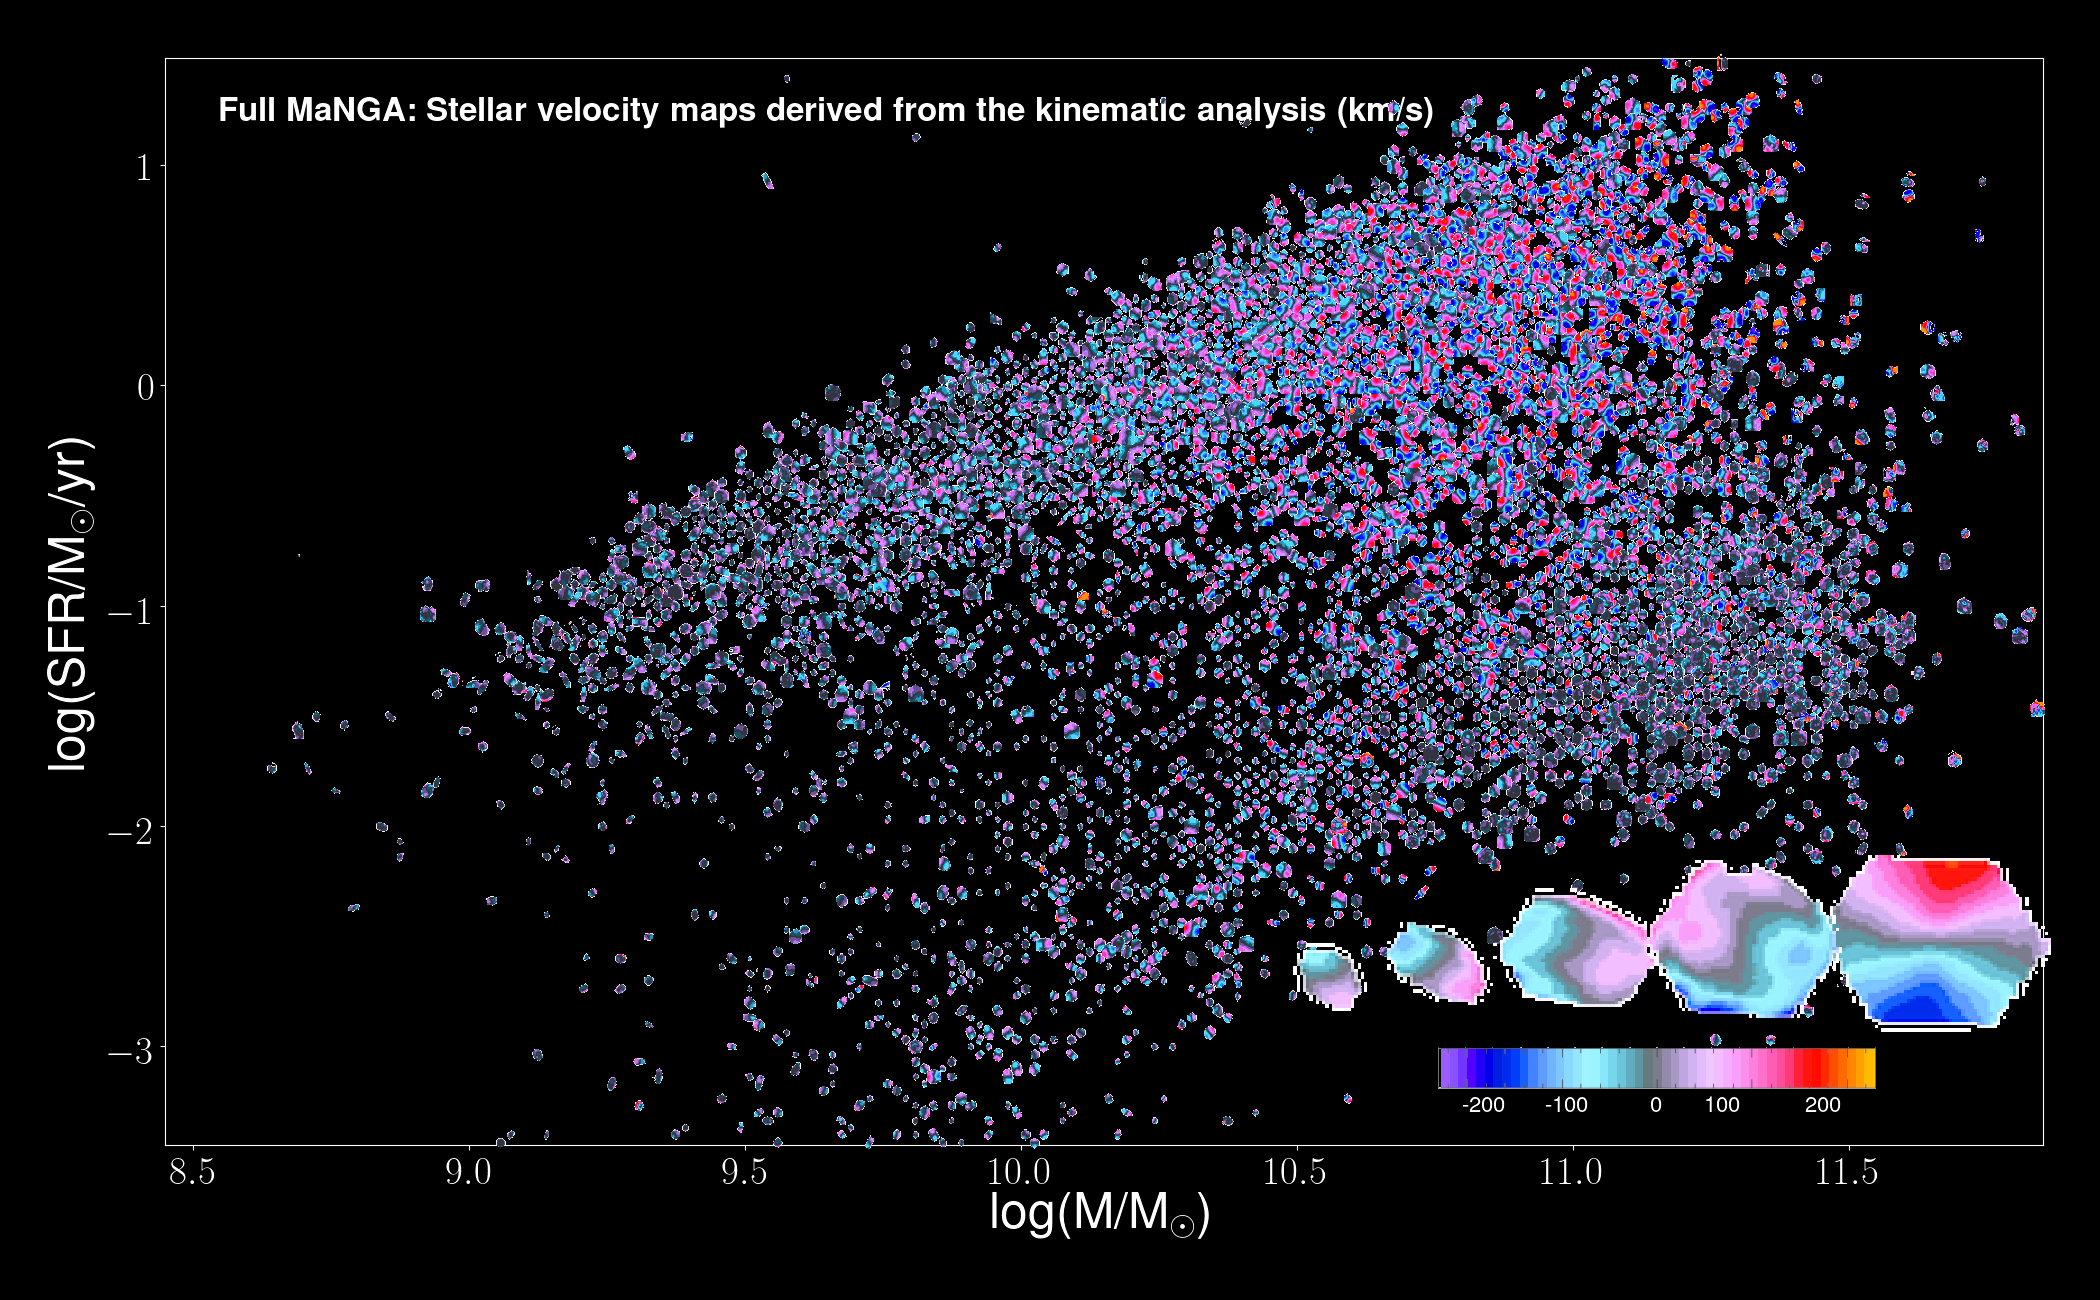
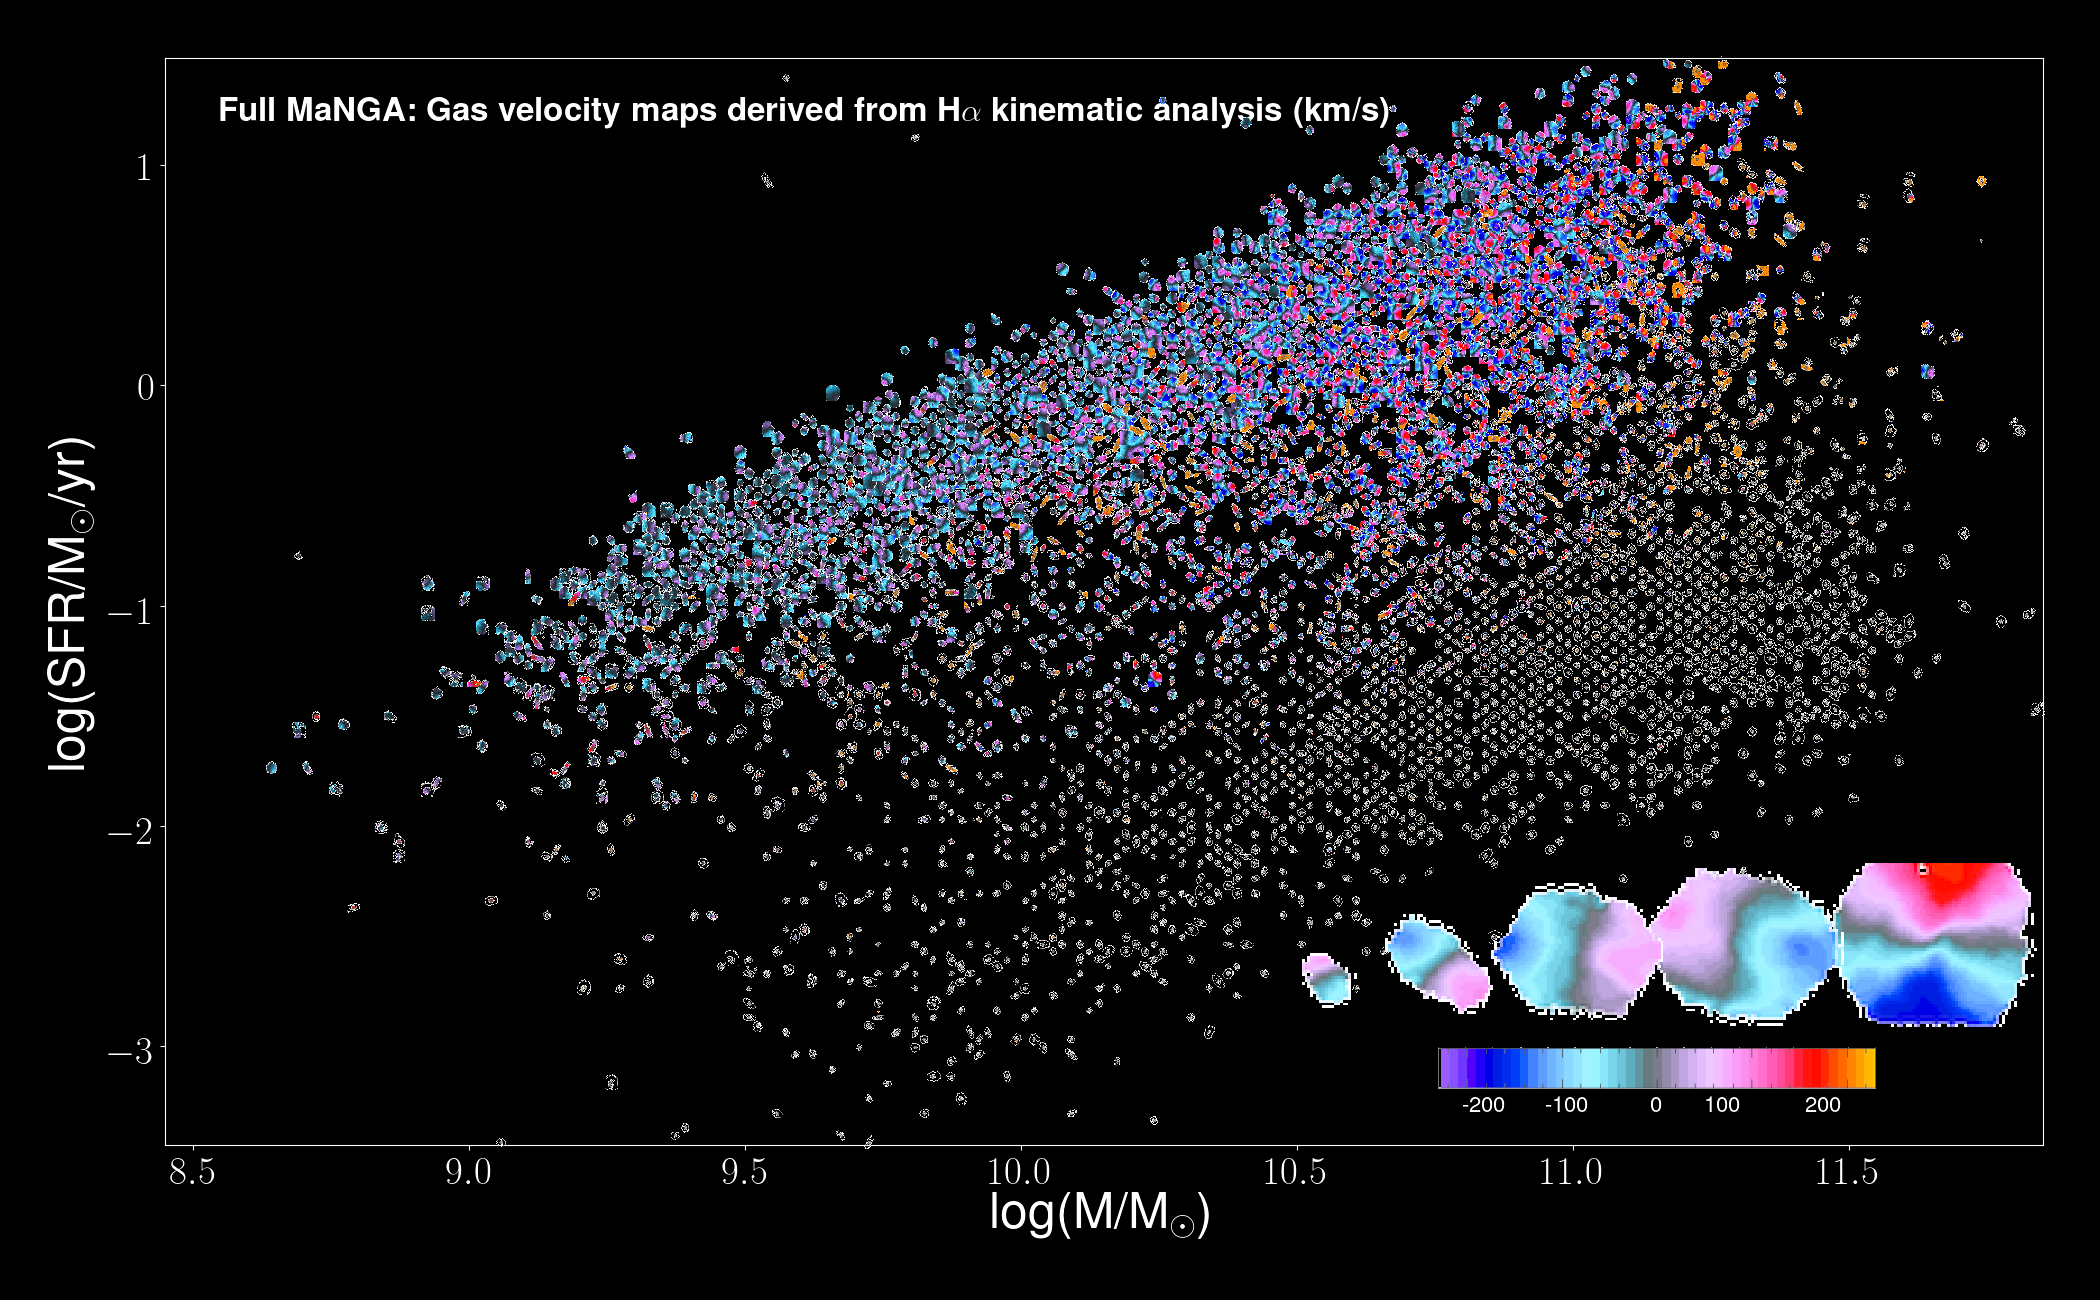
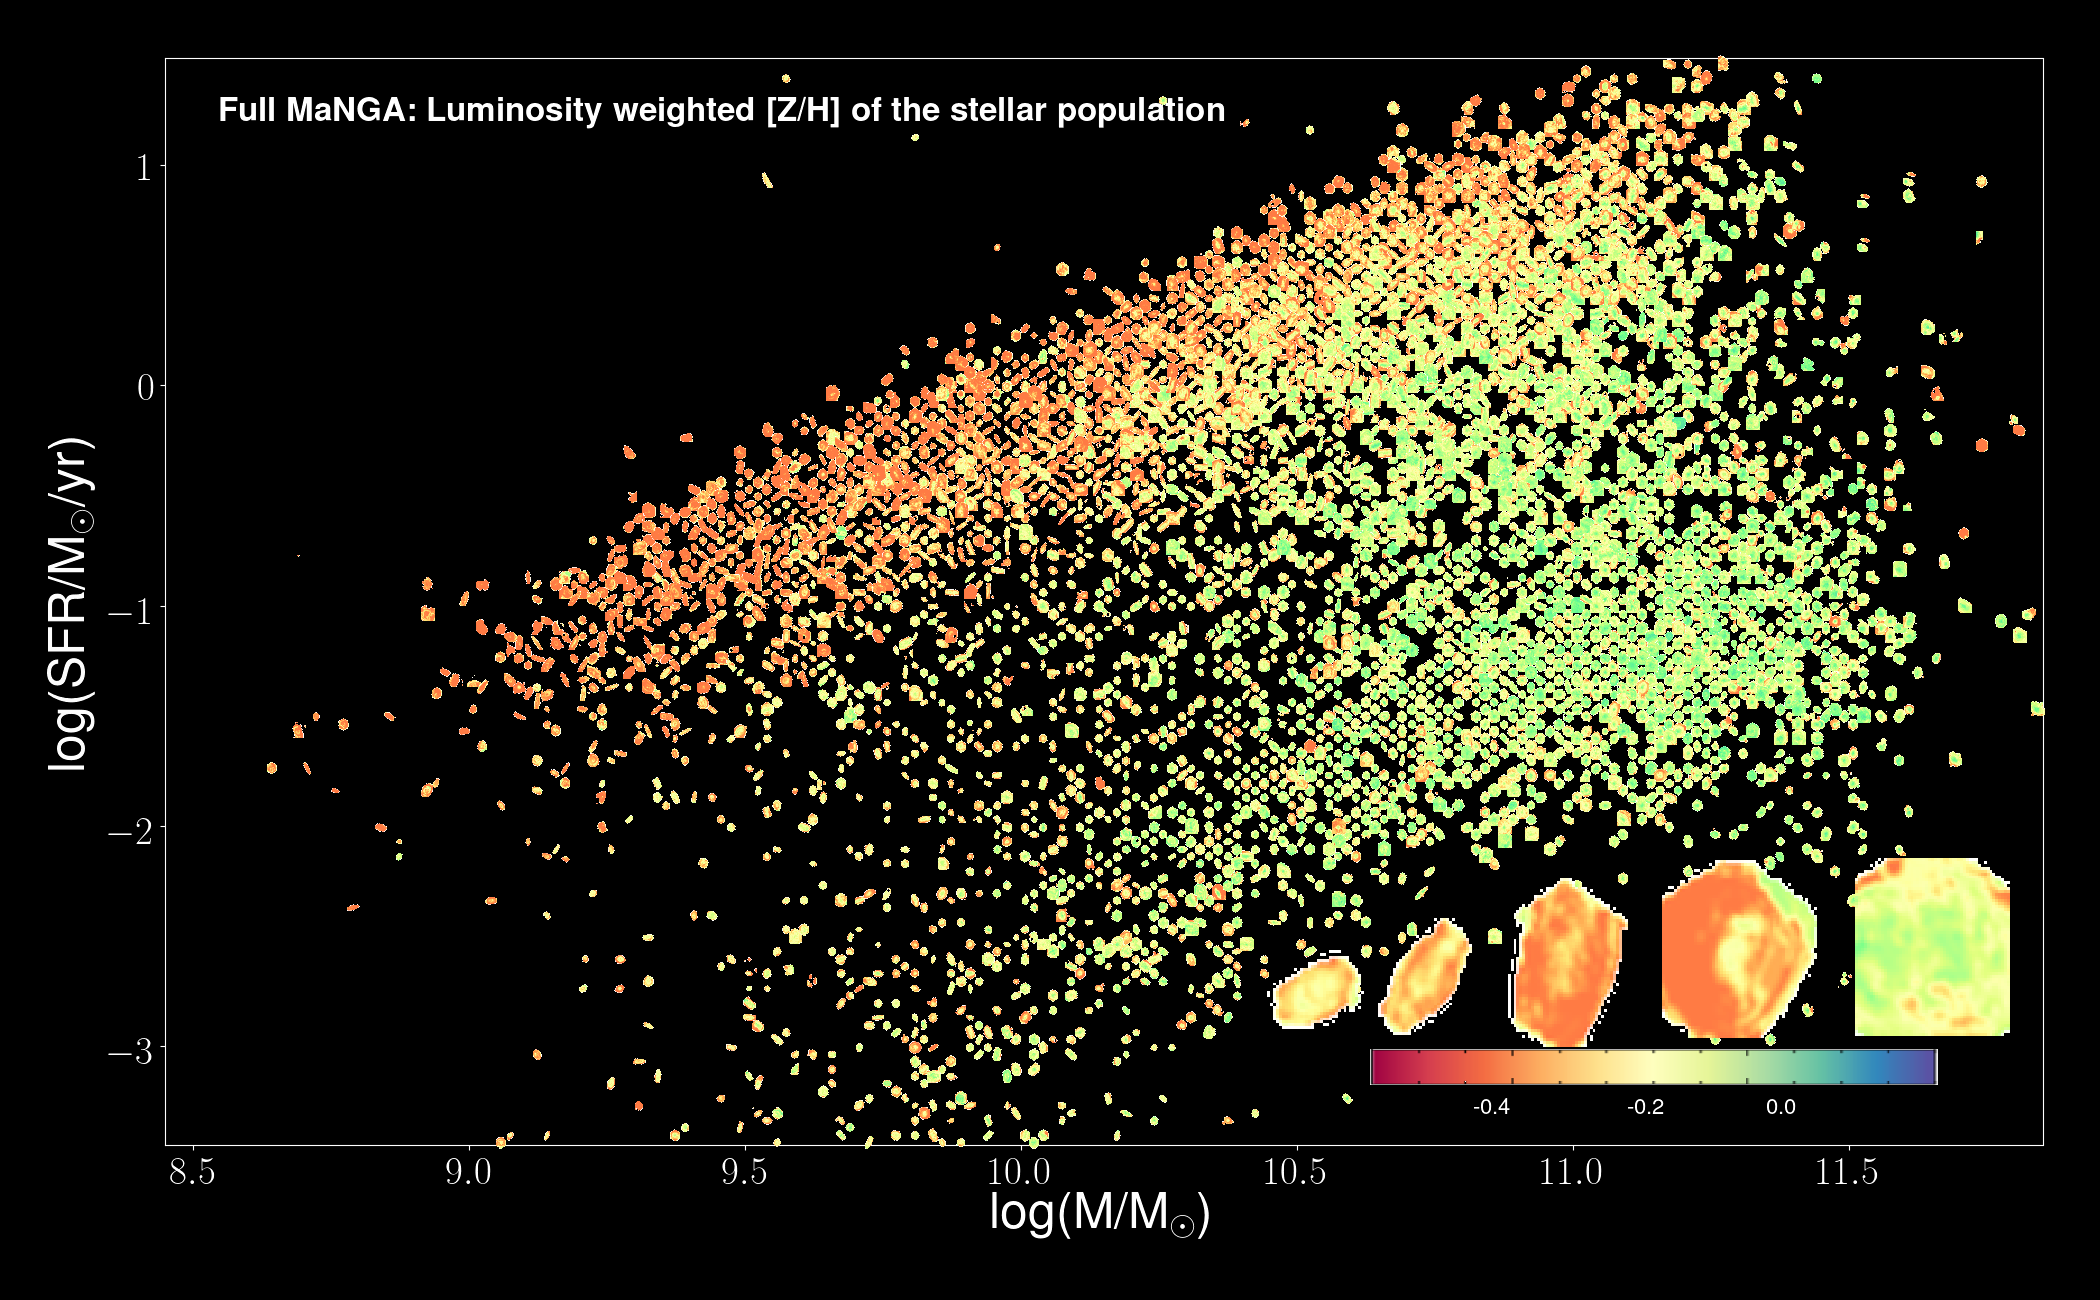
The following figure shows the distribution along the so-called Star Formation main sequence (actually the Hα Luminosity vs. the Stellar Mass) for a subset of galaxies included in this distribution. In each panel, each galaxy is represented by the two dimensional distribution of a particular property of the galaxy. From top-left to bottom-right: (1) the light distribution in the u, g and r-band, (2) the light distribution in [OIII], Hα and [NII], (3) the light-weighted age distribution, (4) the stellar velocity map, (5) the ionized gas velocity map, and (6) the distribution of stellar metallicity. Click on an individual panel to enlarge.
 |
 |
 |
 |
 |
 |
Quality Control
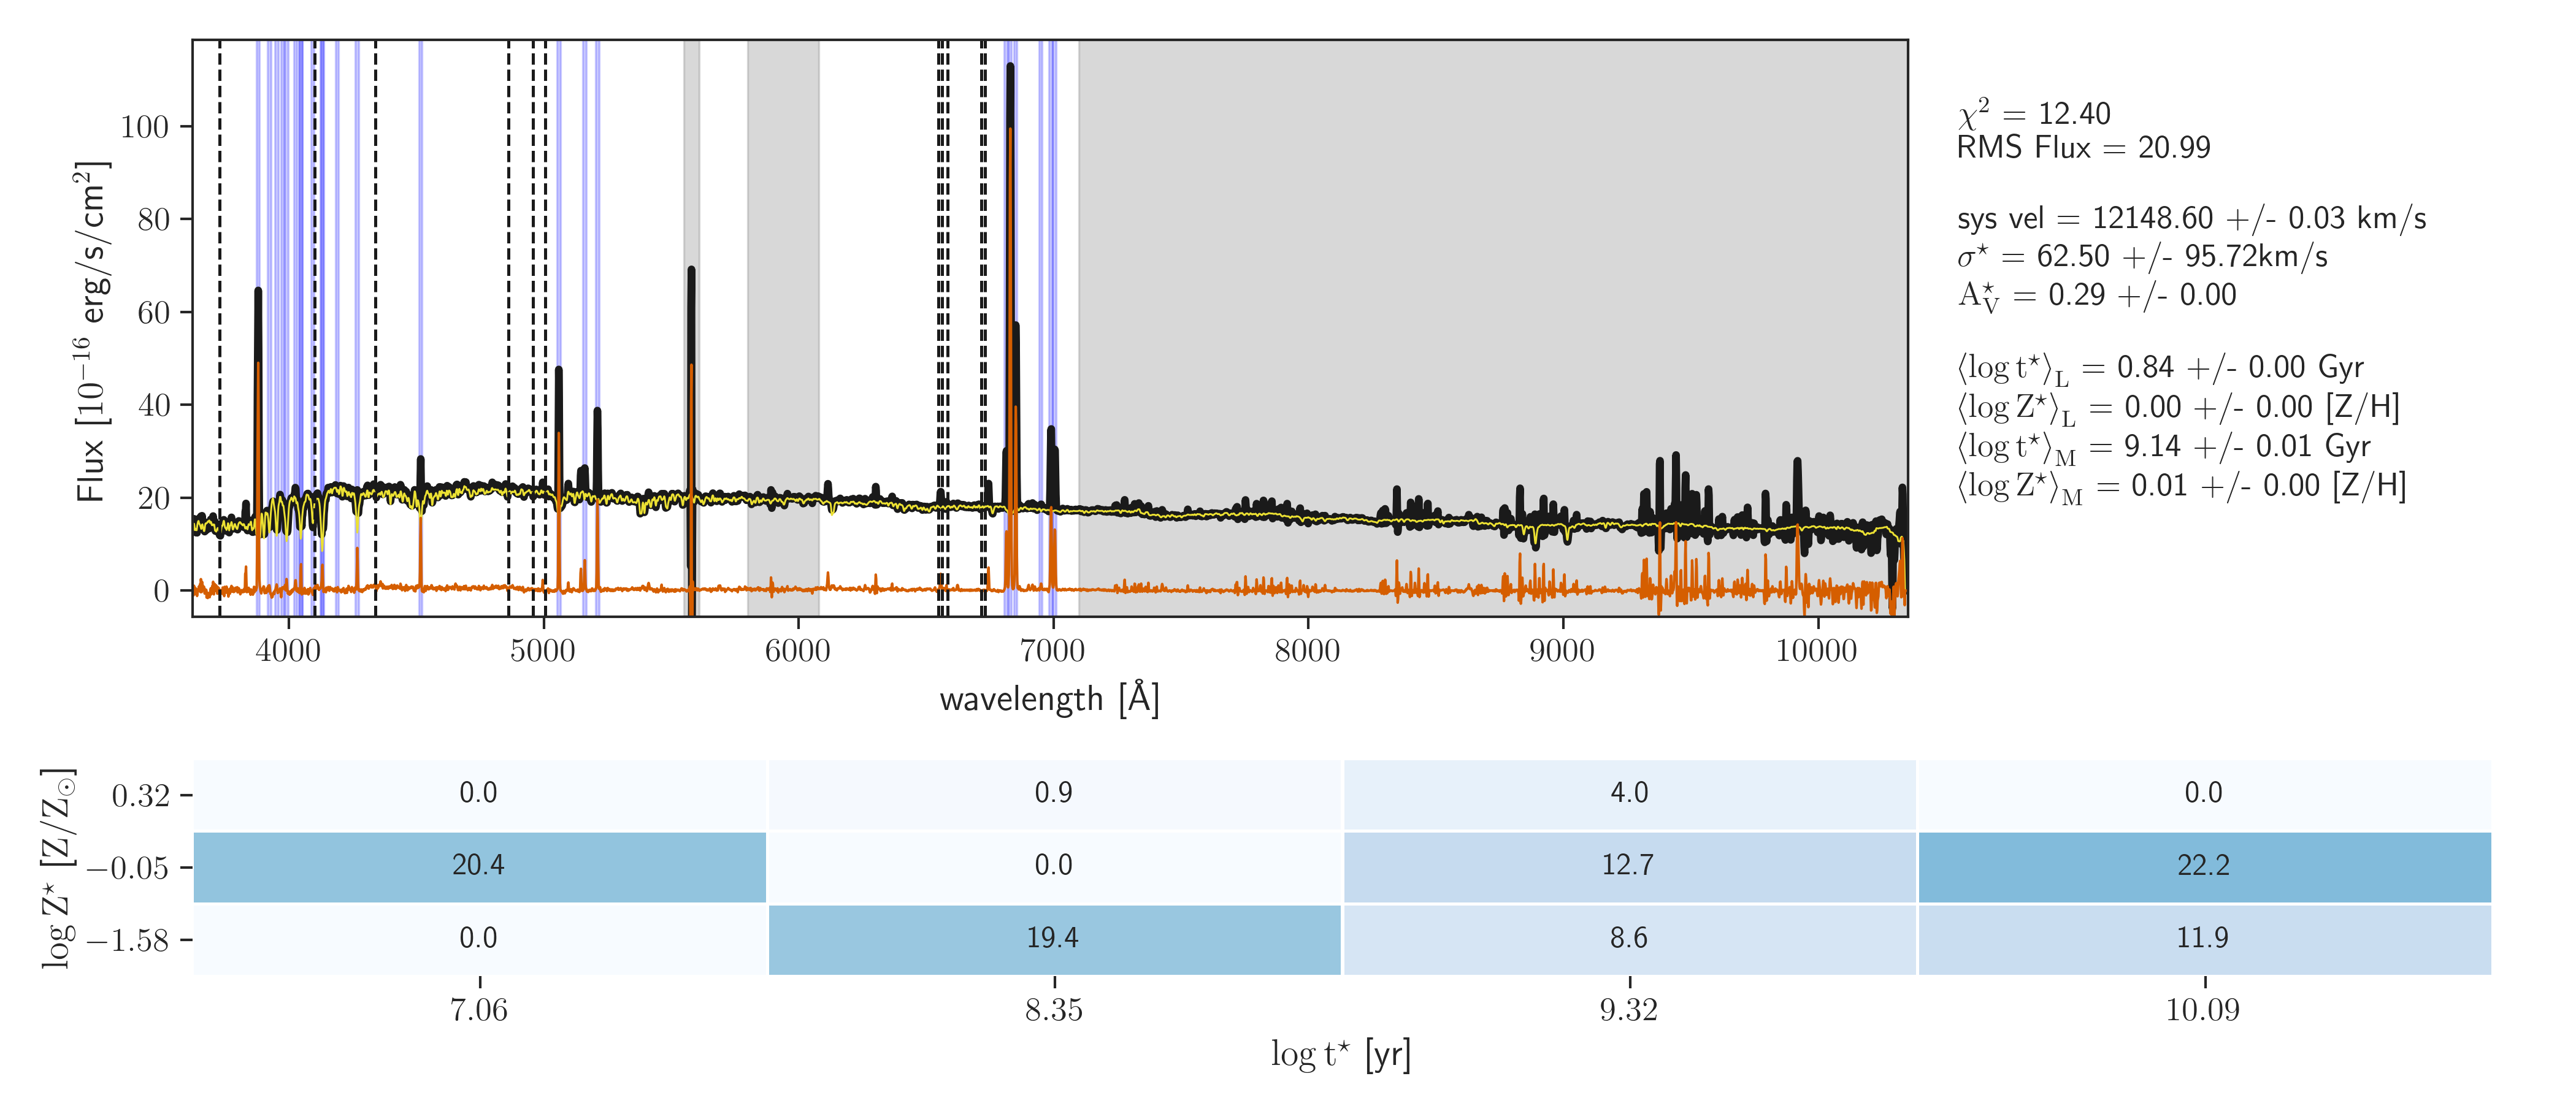
A visual inspection was applied to (1) the integrated spectrum (15 arcsec/diameter) and best fitted model, and (2) the continuum and emission line maps, as shown below, in order to identify critical/evident problems that may affect the quality of the data for the ~10200 analyzed datacubes. An example of those plots is shown below. When there is a clear issue with the data or the fitting, the galaxy/cube is marked and it is removed from the list.
 |
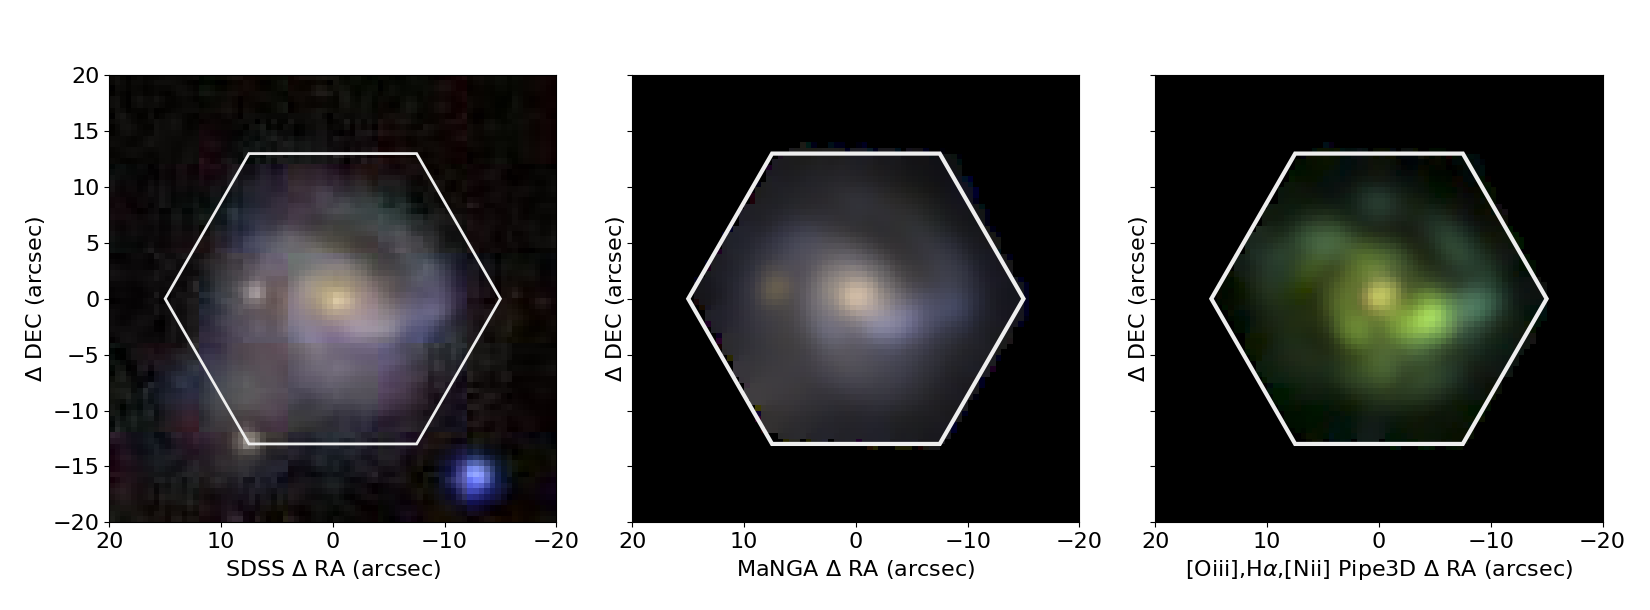 |
| Example of the best fitted model to the central spectrum for a MaNGA galaxy | From left to right: (1) SDSS g,r,i image; (2) MaNGA g,r,i image; (3) [OIII], Hα, [NII] emission line intensity image |
Note: Similar plots can be found for all the galaxies in the following location
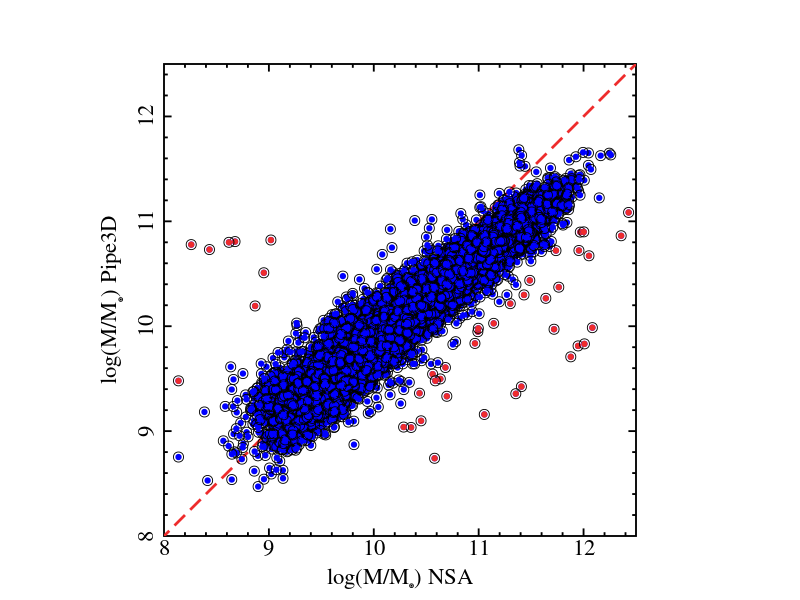
In addition to the visual inspection, to test the accuracy of the derived quantity we have performed a few very simple comparisons between the quantities derived by Pipe3D and that included in the NSA catalogue, including two basic parameters, the integrated stellar mass and the redshift:
 |
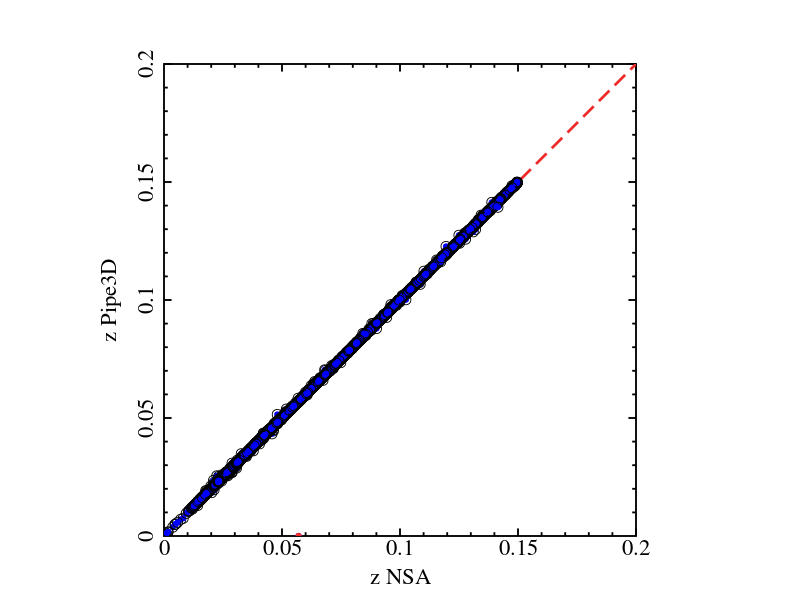 |
| Left-panel: Comparison between the stellar masses derived by the NSA and Pipe3D. Most masses agree within ~0.24 dex (1-sigma), with only 43 galaxies being out by more than 2 sigma. The mean offset between both datasets is 0.07 dex, corresponding to the difference between the adopted cosmologies and the differences in initial mass functions (IMFs). | Right-panel: Comparison between the redshift derived using the stellar information by Pipe3D and the one listed in the NSA catalog. An offset of 80 km/s (z_NSA-z_Pipe3D) is observed. A total of 28 outliers are found in this comparison (all of them producing differences in the stellar mass too). |
In general the number of galaxies with clear offsets between the NSA and the Pipe3D results is small (~1%), and so far the nature of these discrepancies are not clear. More comparisons are foreseen in future analysis.
In addition we place a warning to all galaxies that present: (a) a clear AGN contamination that affects the fitting; (b) the presence of a strong foreground star that may affect the results (we created a mask for the brightest ones, based on GAIA DR3); (c) some issues with the fitting that do not affect the main properties. In total, 392 galaxies/cubes present some kind of warning. These warnings have been included in the QC-file.
Access to the data
The different dataproducts can be downloaded from the following links:
- Full set of individual FITS files, sorted per plate: SDSS-IV Pipe3D link
- Catalogue of derived quantities for the galaxies considered here.
- QC-flag catalogue.
- Star Masks derived from GAIA DR3
Caveat
Acknowledgement
These dataproducts are freely offered to the community. If you make use of these data products, we only request that you include the following line in the acknowledgements: This project makes use of the MaNGA-Pipe3D dataproducts. We thank the IA-UNAM MaNGA team for creating this catalogue, and the Conacyt Project CB-285080 for supporting them., and to cite the following papers: Sánchez et al. 2016b, RevMex, 52, 171 and the paper presenting this VAC (Sánchez et al. 2022, ApJS, 262, 365).